Brainlit


This repository is a container of methods that Neurodata usees to expose their open-source code while it is in the process of being merged with larger scientific libraries such as scipy, scikit-image, or scikit-learn. Additionally, methods for computational neuroscience on brains too specific for a general scientific library can be found here, such as image registration software tuned specifically for large brain volumes.
Motivation
The repository originated as the project of a team in Joshua Vogelstein's class Neurodata at Johns Hopkins University. This project was focused on data science towards the mouselight data. It became apparent that the tools developed for the class would be useful for other groups doing data science on large data volumes. The repository can now be considered a "holding bay" for code developed by Neurodata for collaborators and researchers to use.
Installation
Environment
Install from pypi
install brainlit:
pip install brainlit
Install from source
clone the repo:
git clone https://github.com/neurodata/brainlit.gitcd into the repo:
cd brainlitinstall brainlit:
pip install -e .
How to use Brainlit
Data setup
The source data directory should have an octree data structure
 data/
├── default.0.tif
├── transform.txt
├── 1/
│   ├── 1/, ..., 8/
│   └── default.0.tif
├── 2/ ... 8/
└── consensus-swcs (optional)
    ├── G-001.swc
    ├── G-002.swc
    └── default.0.tif
If your team wants to interact with cloud data, each member will need account credentials specified in ~/.cloudvolume/secrets/x-secret.json, where x is one of [aws, gc, azure] which contains your id and secret key for your cloud platform.
We provide a template for aws in the repo for convenience.
Features
Registration
The registration subpackage is a facsimile of ARDENT, a pip-installable (pip install ardent) package for nonlinear image registration wrapped in an object-oriented framework for ease of use. This is an implementation of the LDDMM algorithm with modifications, written by Devin Crowley and based on "Diffeomorphic registration with intensity transformation and missing data: Application to 3D digital pathology of Alzheimer's disease." This paper extends on an older LDDMM paper, "Computing large deformation metric mappings via geodesic flows of diffeomorphisms."
This is the more recent paper:
Tward, Daniel, et al. "Diffeomorphic registration with intensity transformation and missing data: Application to 3D digital pathology of Alzheimer's disease." Frontiers in neuroscience 14 (2020).
https://doi.org/10.3389/fnins.2020.00052
This is the original LDDMM paper:
Beg, M. Faisal, et al. "Computing large deformation metric mappings via geodesic flows of diffeomorphisms." International journal of computer vision 61.2 (2005): 139-157.
https://doi.org/10.1023/B:VISI.0000043755.93987.aa
A tutorial is available in docs/notebooks/registration_demo.ipynb.
Core
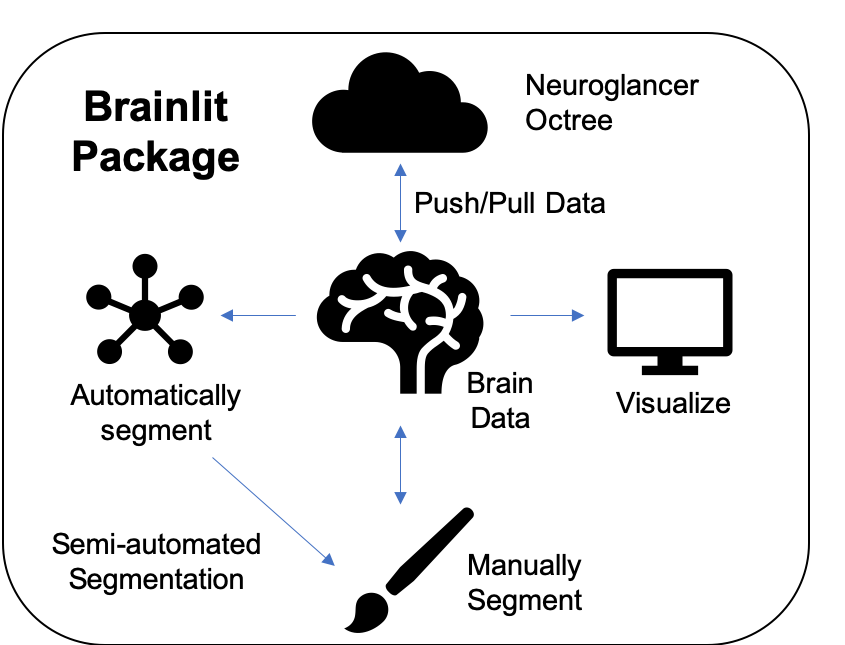
The core brain-lit package can be described by the diagram at the top of the readme:
Push and Pull Data
Brainlit uses Seung Lab's CloudVolume package to push and pull data through the cloud or a local machine in an efficient and parallelized fashion. Uploading demo showcases how to upload both brain volumes and neuron traces. Likewise, downloading demo shows how to download data.
We note the CloudVolume's only requirement is to have an account on S3, as the brain data is publicly available.
Visualize
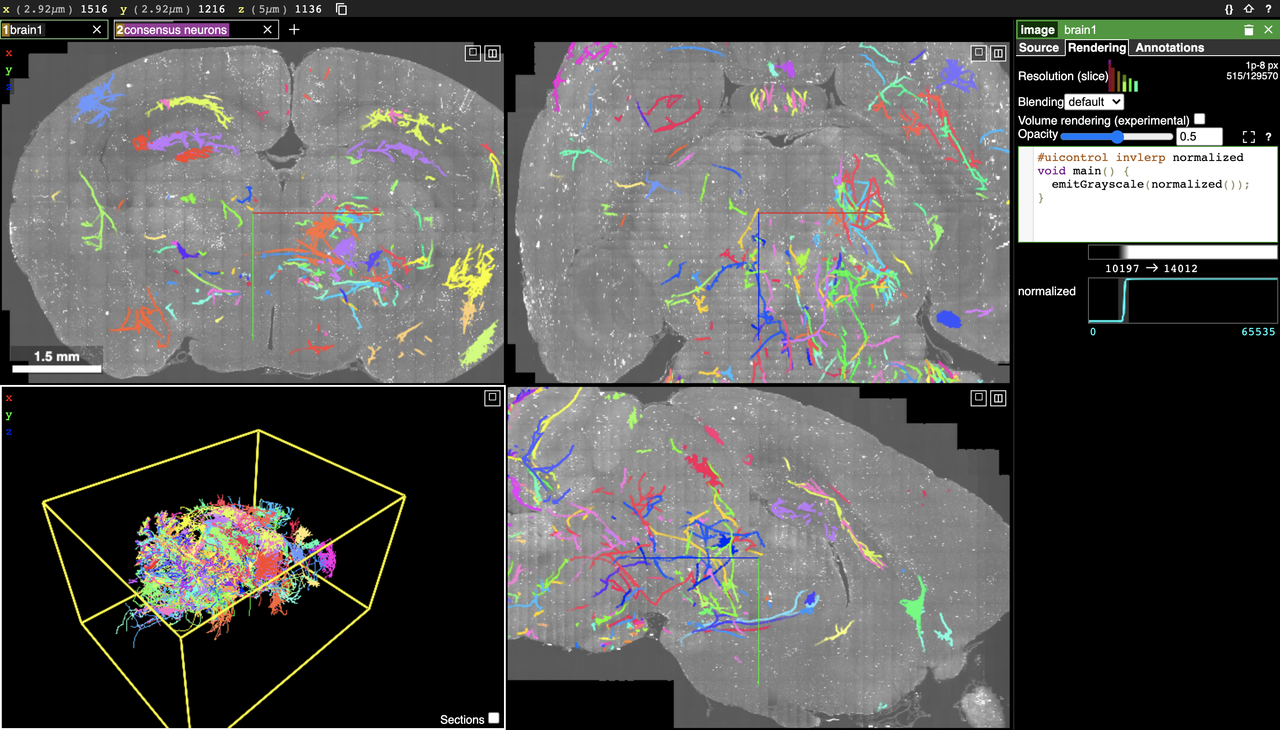
Brainlit supports many methods to visualize large data. Visualizing the entire data can be done via Google's Neuroglancer directly in your browser. For example, this link will visualize a slice of one of the brains contained in the MouseLight dataset provided by HHMI Janelia, as shown in the screenshot below
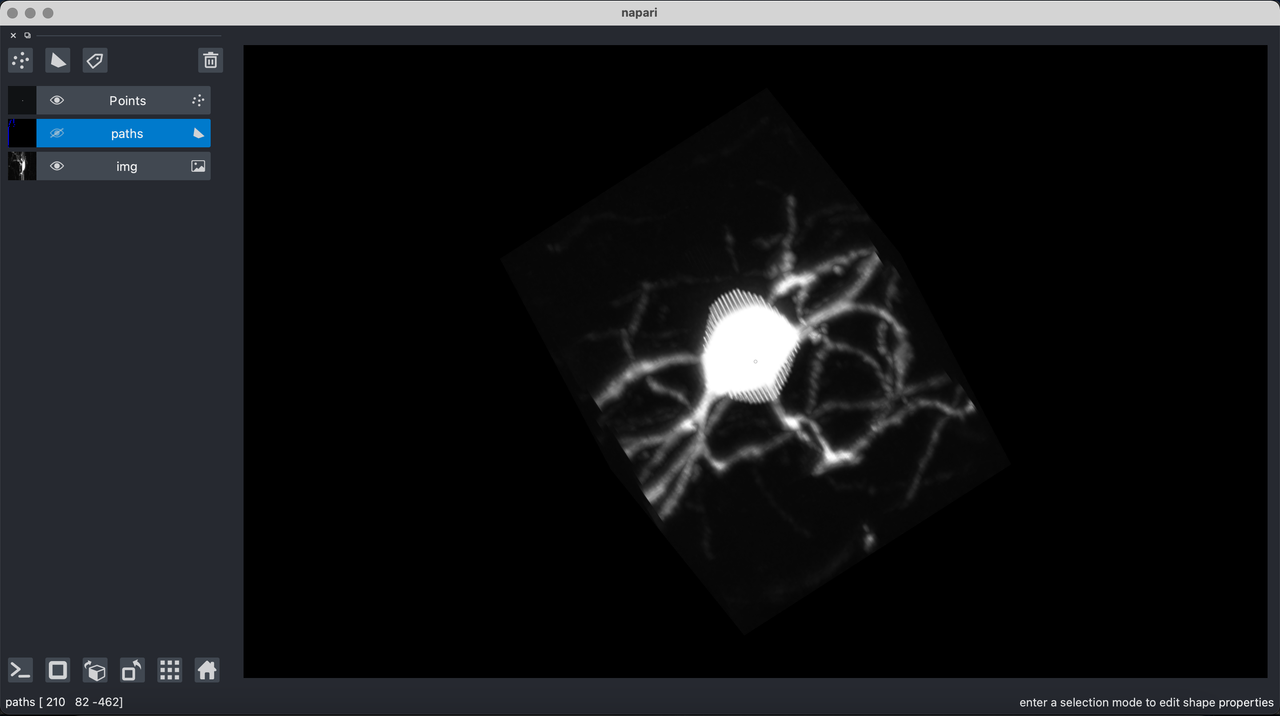
Brainlit also has tools to visualize chunks of data as 2d slices or as a 3d model. The visualization demo will open the following napari view of a volume of brain
Manually Segment
Brainlit includes a lightweight manual segmentation pipeline. This allows collaborators of a projec to pull data from the cloud, create annotations, and push their annotations back up as a separate channel. Auto demo.
Automatically and Semi-automatically Segment
Similar to the above pipeline, segmentations can be automatically or semi-automatically generated and pushed to a separate channel for viewing. Semi-auto demo.
Tests
Running tests can easily be done by moving to the root directory of the brainlit package ant typing pytest tests or python -m pytest tests.
Running a specific test, such as test_upload.py can be done simply by ptest tests/test_upload.py.
Contributing
We welcome all contributors, and encourage them to follow our contribution guidelines found in CONTRIBUTING.md. Issues with the "good first issue" tag are meant for contributors that are either new to open source coding, or new to the package. Additionally, users are encouraged to use issues not only to discuss code-related problems, but for more general discussions about the package.
Credits
Brainlit is a product of the neurodata lab. It is actively maintained by Thomas Athey (@tathey1) and Bijan Varjavand (@bvarjavand), and is regularly used and contributed to by students in the Neuro Data Design course. We strive to follow the same code of conduct that applies to the Microsoft open source community.